
Frequently Asked Questions
Why did you create this project?
The importance of community attributes in determining the economic vitality and prosperity of communities is well understood among those who seriously study economic development; however, few policy makers (and even fewer citizens) enjoy easy access to data and analysis that provides insight into where a specific community stands across different comparative data elements. Site selectors and relocation consultants use these data sets routinely but typically maintain proprietary or subscription-based data sets.
How did you choose the categories and variables?
Several studies across many disciplines link specific types of data to long-term prosperity (such as human capital, school performance, government efficiency, quality of place, and health outcomes). Using readily available public data sets, we collected and categorized them into clear categories. We hope to expand this project significantly as the need for specific types of data become more apparent.
How did you derive grades?
The grades were given based on a curve, with equal numbers of As and Fs, and of Bs and Ds. High-quality research hasn't yielded a sufficient weighting for each category, so we simply provided grades for each county based upon the average ranking of the data within each category. The more variables in each, or the more analytically derived the data (like school test scores), the more reliable the ranking. The reason for this is that data sets tend to be covariates or move together. Regions with low levels of educational attainment tend to have fewer well-performing schools. Places with high rates of one type of morbidity (poor health) tend to have high rates in several others. So the use of more data in each category tends to minimize the statistical bias a single datum may have.
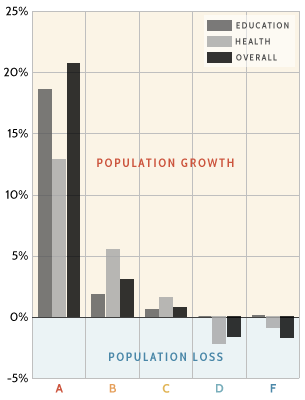
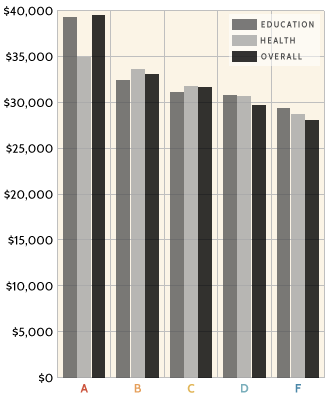
We also think we've hit on something in this study that should provide a good indicator of the effectiveness of these data sets. In the following figure, we have graphed average population changes in communities based on their quality of place ranking, their human capital education and human capital wealth grades (see Figure 1). The result is fairly telling of the relationship between population growth and quality of place. We have also graphed the level of per capita income by these factors (see Figure 2). Again, we believe our data sets tell a compelling story for communities in Indiana.
Aren't you concerned that this will hurt the marketing image of these communities?
No. All of the data we use is publicly available. Anyone seriously considering relocating to a community will examine parts of these data sets, while any consultant advising companies to seriously expand or relocate to a community will most likely have already screened several candidate communities for attributes they find unattractive. Bottom line, the folks who are thinking about coming to or staying in your community already know these things. The truth itself is never bad, but ignoring the facts can be harmful.
What is the greatest weakness of the Community Asset Inventory and Rankings?
These rankings are performed at the lowest level possible, the county level. It would be equally important to also compare municipalities within counties. There are also types of data missing that we'd like to add as part of our continual improvement. Please provide your comments, suggestions for user experience, and/or recommendations for data we could reasonably include by emailing us at cber@bsu.edu.